Showing posts with label SP500. Show all posts

Tuesday, February 5, 2019

Two Winning Trade Setups - GDXJ and ROKU

We are not always correct in our calls about the market. Professional researchers and analysts must understand that attempting to accurately predict the future outcome of any commodity, stock, index or ETF is impossible to be 100% accurate. Yet, we are pleased that our proprietary price modeling and analysis tools continue to provide us with very clear triggers and alert us to price moves before they happen.

Today, we are sharing two recent trades we executed with our members that resulted in some decent profits. The first example is our GDXJ trade. We had been in a Long position since before the beginning of 2019 expecting Gold and Miners to rally. Our price modeling systems suggested that after price reached $1300, we may experience a brief price pause over the next 45 days or so. Thus, we pulled the profits in this trade recently to lock in 10.5% profit and to allow us to re-enter when our modeling systems suggest the price pullback has ended.


The second example is our ROKU trade. We recently pulled 8.1% profit on a partial profit target execution for our members after a nice upside momentum move. This type of trade falls into our MRM (Momentum Reversal Method) trade trigger category and is supported by a momentum resurgence price move that can typically prompt prices to move +8~30% over fairly quick periods of time (under 20 days).


For almost all traders, we’ve found that understanding general market conditions, finding suitable trading triggers/setups and staying aware of the market dynamics at play in the global markets is very hard to accomplish. This is why we offer our members a very quick and easy way for them to accomplish all of these essential components for success with their membership to Technical Traders Ltd. Wealth Trading Newsletter.

  •  Our Daily Market Video, which is typically under 10 minutes in length, covers all of the major markets, most commodities, the US Dollar, Bitcoin and many other elements of the markets.


  • Combine this video content with our detailed market research posts, which you can read by visiting The Technical Traders Free Research, allows our members to not only learn from our video content but also to begin to understand and formulate their own conclusions based on our content.


  • Lastly, we add our trading trigger/alerts feature to alert our members to superior trading setups that we find while running our proprietary trading models. We don’t post 40 trades a day hoping our members will find one or two they can make profits from. We are highly selective in our posts and attempt to only post the best opportunities for success.

Over the past couple of months, we have been developing a new members area application. It will allow you to have live access to our morning spike and gap trades and traders chatroom, our SP500 index momentum, and swing trades, plus our special MRM (Momentum Reversal Method) stock picks on small/mid-cap stocks which also all trade options so if you want to you can trade options on your own around our stock trades.

Last week we made huge progress and this week’s goals are to implement the instant and automated SMS and email alerts sent to you every time there is a new trade, stop, target hit, or we close a position. This will give you more time to see and execute the trades as needed. Keep in mind most swing trades can be entered 1-3 days after the trade alert at the same price or better price simply because we are not that perfect at timing the markets every move.

If you take a minute to review these example REAL TRADES (above) and review the information at The Technical Traders, we believe you will understand the value and resources we offer our members. Isn’t it time you found the right team of professionals to help you make 2019 an incredibly successful year?

Chris Vermeulen


Wednesday, January 16, 2019

How To Consistently Make Money Day/Swing Trading

This has been the best week in a long time for intraday trades. The last 4 days the SP500 gave us 8 trades and all 8 turned into winners. Each days turning generating between $300 a $1250 per ES mini contract, although these can be traded using the SPY or 3X index ETFs.

Subscribers who day trade are taking this pre-market analysis and setups and making a weeks wage within 1 – 3 hours in the morning before lunch.

What makes these trade triggers is that they are the BROAD market SP500 so if you day trade other stocks knowing the short term market direction each morning add so much power to your other day trades for timing entries and exits.


This chart focuses on today’s spike higher and gap lower. both these played out once again and are based strictly on technical analysis and statistical analysis.


Stock & ETF Trading Signals

Wednesday, December 26, 2018

The SP500 Breaks 2018 February Lows - What Next?

The ES (S&P e-mini contracts) broke the support level from the February 2018 lows immediately after the US Federal Reserve announced a 25 bp rate hike this week. This breakdown below the February 2018 lows is concerning because it indicates that previous support is not holding and we could be in for further downside price activity.


We are preparing a detailed research post for early next week regarding a broad range of US markets as well as how our proprietary price modeling systems are reflecting this recent price move. What we can suggest to all investors is play small positions at the moment and prepare for increased volatility. There is near term support that may come into play soon, but overall the markets are reacting to a deleveraging event that could see prices push below 2400 before finding true support.

Visit The Technical Traders to read all of our recent research posts and see what we believe will be the big movers in 2019.

Chris Vermeulen


Stock & ETF Trading Signals

Saturday, November 24, 2018

Crude Oil and Bitcoin Hit New Yearly Lows

For the first time in a year WTI crude oil is traded below $54 a barrel hitting a low of $53.63. Oil fell as much as 6% as fears are surfacing that OPEC's planned production cuts will do little to stave off a surge in global stockpiles.

Bitcoin finally made a significant move to break out of the tight trading range that it had been trapped in. Unfortunately for Bitcoin bulls, it was not the move that they were looking for as it dropped almost 13% on Monday and continued lower Tuesday shedding another 4.8% to trade at the new yearly low of $4,547.00. The cryptocurrency is now down more than 60% year to date and more than 70% since its all time high. Where will it stop? $3000, $2000 or $1000?


Not to be outdone by oil and Bitcoin, stocks are all continuing the sell off that started Monday with the S&P 500 dropping 1.6%, the DOW is once again below 25k, shedding 2% and the NASDAQ is trading back below 7,000 losing 1.6%. The recent sell off has once again pushed the stock market back below the yearly open, shedding all of the gains that came with record highs earlier in the year which has driven all three indexes into correction/bear market territory. It's looking more and more like we have a good to chance to end the year lower unless we get the Santa Clause rally.

Jeremy Lutz
INO/MarketClub


Wednesday, September 19, 2018

Predictive Model Suggest a Massive Market Rotation During the U.S. Elections

Just in time for what appears to be a potentially massive market price rotation, our researchers have put together this post to highlight what we believe will become a surprise price correction in the US Equities markets. Our team of researchers believes the correlation of our predictive modeling tools, predictive cycle tools, and other indicators are set up for what may become a massive 5 - 8% price rotation over the next 60 days.

We were expecting this rotation to start unfolding around mid-September (now) but at this time the technical are still bullish so we are not betting against the market just yet.

The combination of new US tariffs ($200 Billion about to hit in the China trade war), as well as a combination of technical issues with regards to Technology Stocks and retail expectations, could jolt the market if a correction does take place as our predictive modeling tools suggest. A simple rotation of 2 - 3% is fairly common in the markets. These predictive modeling solutions are suggesting we are just 4 - 5 days away from the start of a much bigger correction in the US Equities and Indexes.

We believe the coming US elections in combination with the other aspects of the global economy are going to drive a downward price correction that many people are not expecting right now. But there is one pocket of stocks that could benefit from this tariff stuff which members or our Wealth Building Newsletter just got long today!

Anyway, Let’s take a look at some of our index charts to see how this will likely play out.

This first chart is a Daily ES chart showing our Adaptive Dynamic Learning (ADL) predictive price modeling tool. The YELLOW/CYAN dashed lines over the price bars and into the future show the highest probable outcome from the ADL predictive modeling analysis. This instance that predicts a 5 - 6 day price advance before a price peak sets up consisted of 105 unique instances of correlative price data making up this predictive analysis. In other words, 105 unique instances of similar predictive price patterns and predicts future price moves based on the highest likely outcome of all instances of data.

In this case, the ADL modeling system is suggesting we have about 4 - 6 more days of moderately higher price activity before a price top/peak will setup – prompting a new downward price trend.


This ES Weekly ADL price chart correlates with the Daily chart almost perfectly. The Weekly chart predicts one additional week of upward price action before a massive 5 - 6% price decline drives prices lower. This massive price rotation executes over a 1 to 2 week span before briefly stalling, then an additional price decline of about 2% sets up driving prices to a predicted low near $2670 (-8.58%) on November 1, 2018 (just before the US elections).

This ADL analysis was generated by 112 unique instances of similar price data and the combined highest probability outcome is shown by the YELLOW and CYAN dashed lines on the chart. Simply put, we have a very high probability of a 5 - 8% price correction setting up over the next 20+ days in the U.S. Equities markets with a projected bottom setting up near $2670.


This last Weekly Transportation Index chart displaying the ADL predictive modeling system paints a very interesting picture when you combine it with the two earlier charts. The Transportation index typically leads the major markets by about 3 to 6 months. We have seen continued upside price advances in the Transportation Index over the past 6 months which leads us to think the US equities markets will continue to push higher overall.

Yet, this Weekly ADL predictive modeling chart shows two massive price rotations are likely to unfold before the end of 2018. The first one is set up for a downside price rotation, ending near $10,800, starting the week of September 17, 2018, and lasting about 3 - 4 weeks. Then, the ADL predicts the Transportation Index will rocket higher, near $11,800, for about 5 - 6 weeks before falling again to retest the $10,800 lows near early December 2018.

We believe critical global news and expectations regarding global trade, banking and credit may become the catalysts for these moves. The US is expected to enact over $200 billion in trade tariffs this week with China. We believe the ADL predictive modeling system is capable of identifying these massive price rotations and predicting the future rotations simply because of the massive amounts of data that it is capable of crunching. This Weekly ADL prediction consisted of 112 unique price instances and displays only the highest probable outcome. In other words, our predictive modeling system is suggesting these price moves are likely to happen based on its analysis with a greater than 50% probability.


Please pay close attention to our research posts and other articles throughout the end of this year and early into 2019. As we have been attempting to warn our followers, expect increased volatility and wider price rotation throughout the end of this year.

We expect to find a number of incredible opportunities for our members over the next few months and we have already been incredibly successful throughout this recent price rally. Our ADL systems predicted this upside price move in February of 2018 and we have stuck with it. Now, the ADL is predicting a massive rotation is about to take place – somewhat similar to February 2018. If you want to learn how to profit from these moves, visit The Technical Traders to learn how we help our members stay ahead of these types of market moves.

Chris Vermeulen
The Technical Traders Ltd.


Stock & ETF Trading Signals

Sunday, September 17, 2017

Positioning for “Swan Type” Disasters

Recently, the US, China and portions of SE Asia have been hit by massive hurricanes and cyclones. As investors, it is often difficult to understand the mechanics of how these types of disasters result in opportunities while thousands are attempting to rebuild and survive. Yet, as investors, it is our job to prepare for these outcomes and attempt to foresee risk and opportunities.
Over the weekend, we expecting Hurricane Irma to hit Florida and most of the South US, one should be asking the question, “How will this drive the markets over the next few weeks/months?” Let’s explore this question with some hard data and analysis.
US Population Density
The population in the South Eastern US is rather dense. There are also a number of key economic locations that could be disrupted if the storms starts to drift eastward.

Economic Output by Region


Consider that the South Eastern US represents a minimum of 1.6~2.2% annual GDP output.
When one considers the amount of destruction, disruption and economic decline that could be the immediate result of disasters such as hurricanes, one has to think about how the global markets will react to this level and type of event?
In comparison to the other geographic regions of the US, the South Eastern portion of the US still represents a substantially large portion of annual economic output/activity.

A massive disruption as well as asset revaluation event could cause a “blip” in the US GDP representing at least 2~3 tenths of a percent and could result in hundreds of billions in actual losses, economic output losses and infrastructure destruction.
Because of this, and other potential future events, we are concerned that the US markets may be headed for a correction event or bear market event in the near future. In the past, we have attempted to illustrate this potential by highlighting cycle events, key market breakouts and trends and, most recently, highlighted the 3-7-10 year cycle structures that play out in all markets. Now, we are setting up for an event that may unfold over the next 30~90 days as a “swan type event” that few are preparing for.
The US Dollar continues to slide. Our analysis showed that $92 was key support. Recently this level has been broken and we are concerned that the US Dollar may continue to slide lower. Overall, in terms of global competition, this may not be a tremendous hit. But in terms of purchasing power and the existing dominance of the US Dollar for trade, we could see some pressure in other areas.

In relation, our custom China/SE Asia Index is pushing toward the upward range of our price channel and could rotate lower on a Swan-type event (like a debt issue or political issue).


Oil is breaking downward as these global events and the transition to slower consumption continues to drive supply higher and higher. We could continue to see Oil based “Mini Swan Events” in countries that are dependent on Oil prices and income to support their economies.


US Banking and Insurance firms are sure to take increased risks with these types of events. As borrowers are displaced because of a “Swan type Event” and refocus on immediate needs/issues, delinquencies in mortgages, auto loans, credit cards and others will spike (quickly). This becomes a matter of survival (much like after the 2009 Credit Market Crisis) where people made choices to support immediate needs and not long term credit needs.


Metals, of course, have already started to make a move higher because of the risk of these events and global risks. Although, we still believe a short-term move lower (almost like a relief move) will play out over the next few weeks that will be the opportunity we have been waiting for. This move will allow investors to position metals trades for the potential longer term Swan event outcomes.

Lastly, our US Custom Index is continuing to provide a much clearer and defined picture of the Head-n-Shoulders formation that has us fixated on the potential of our VIX Spike dates, major cycle events, key rotations and, now, these potentially massive “Swan type events” to correlate into almost a Super-Swan Event. These hurricanes are passing events – they go away eventually. An economic event is something that takes much longer to resolve and restore. Much like the 2009 Credit Market Crisis, the results of a Swan type event can be long lasting and can result in massive asset revaluation.
We’re not saying the global markets are going to fall into another 2009 type event, but we are saying that our analysis is showing that “some type of event is setting up and IF it turned into a Super Swan event, then YOU (the investor) need to be aware of this potential”. If it simply turns into a correction or minor downturn, then you still need to be aware of this potential so you can profit from it – either way.


What will it take to setup and execute a series of trades that help protect against this type of possible Swan Event?
Join Active Trading Partners [visit here] today to learn more and follow our daily research reports to assist you in preparing for just this type of event. There is not a lot of time left before these potential events begin to play out. ATP will assist you by finding great trading opportunities and keeping you informed of the markets setups and potential moves/cycles.
Are you ready for the next Super-Swan Event? If not, join Active Trading Partners today.


Stock & ETF Trading Signals

Thursday, September 14, 2017

How Will Disasters Drive the Markets Over the Next Few Weeks/Months?

Recently, the US, China and portions of SE Asia have been hit by massive hurricanes and cyclones. As investors, it is often difficult to understand the mechanics of how these types of disasters result in opportunities while thousands are attempting to rebuild and survive. Yet, as investors, it is our job to prepare for these outcomes and attempt to foresee risk and opportunities.
Over the weekend, we expecting Hurricane Irma to hit Florida and most of the South US, one should be asking the question, “How will this drive the markets over the next few weeks/months?” Let’s explore this question with some hard data and analysis.
US Population Density
The population in the South Eastern US is rather dense. There are also a number of key economic locations that could be disrupted if the storms starts to drift eastward.

Economic Output by Region


Consider that the South Eastern US represents a minimum of 1.6~2.2% annual GDP output.
When one considers the amount of destruction, disruption and economic decline that could be the immediate result of disasters such as hurricanes, one has to think about how the global markets will react to this level and type of event?
In comparison to the other geographic regions of the US, the South Eastern portion of the US still represents a substantially large portion of annual economic output/activity.

A massive disruption as well as asset revaluation event could cause a “blip” in the US GDP representing at least 2~3 tenths of a percent and could result in hundreds of billions in actual losses, economic output losses and infrastructure destruction.
Because of this, and other potential future events, we are concerned that the US markets may be headed for a correction event or bear market event in the near future. In the past, we have attempted to illustrate this potential by highlighting cycle events, key market breakouts and trends and, most recently, highlighted the 3-7-10 year cycle structures that play out in all markets. Now, we are setting up for an event that may unfold over the next 30~90 days as a “swan type event” that few are preparing for.
The US Dollar continues to slide. Our analysis showed that $92 was key support. Recently this level has been broken and we are concerned that the US Dollar may continue to slide lower. Overall, in terms of global competition, this may not be a tremendous hit. But in terms of purchasing power and the existing dominance of the US Dollar for trade, we could see some pressure in other areas.

In relation, our custom China/SE Asia Index is pushing toward the upward range of our price channel and could rotate lower on a Swan-type event (like a debt issue or political issue).


Oil is breaking downward as these global events and the transition to slower consumption continues to drive supply higher and higher. We could continue to see Oil based “Mini Swan Events” in countries that are dependent on Oil prices and income to support their economies.


US Banking and Insurance firms are sure to take increased risks with these types of events. As borrowers are displaced because of a “Swan type Event” and refocus on immediate needs/issues, delinquencies in mortgages, auto loans, credit cards and others will spike (quickly). This becomes a matter of survival (much like after the 2009 Credit Market Crisis) where people made choices to support immediate needs and not long term credit needs.


Metals, of course, have already started to make a move higher because of the risk of these events and global risks. Although, we still believe a short-term move lower (almost like a relief move) will play out over the next few weeks that will be the opportunity we have been waiting for. This move will allow investors to position metals trades for the potential longer term Swan event outcomes.

Lastly, our US Custom Index is continuing to provide a much clearer and defined picture of the Head-n-Shoulders formation that has us fixated on the potential of our VIX Spike dates, major cycle events, key rotations and, now, these potentially massive “Swan type events” to correlate into almost a Super-Swan Event. These hurricanes are passing events – they go away eventually. An economic event is something that takes much longer to resolve and restore. Much like the 2009 Credit Market Crisis, the results of a Swan type event can be long lasting and can result in massive asset revaluation.
We’re not saying the global markets are going to fall into another 2009 type event, but we are saying that our analysis is showing that “some type of event is setting up and IF it turned into a Super Swan event, then YOU (the investor) need to be aware of this potential”. If it simply turns into a correction or minor downturn, then you still need to be aware of this potential so you can profit from it – either way.


What will it take to setup and execute a series of trades that help protect against this type of possible Swan Event?
Join Active Trading Partners [visit here] today to learn more and follow our daily research reports to assist you in preparing for just this type of event. There is not a lot of time left before these potential events begin to play out. ATP will assist you by finding great trading opportunities and keeping you informed of the markets setups and potential moves/cycles.
Are you ready for the next Super-Swan Event? If not, join Active Trading Partners today.


Stock & ETF Trading Signals

Friday, March 7, 2014

How Much Will a 15% Hair Cut Cost Your Investment Capital?

Over the past few weeks I have been watching the DOW and Transportation index closely because it looks and feels like the Dow Theory may play out this year and the stock market could take a 15% haircut.

But what if you skipped on the haircut and opted for a 40% refund?  What? Keep reading to find out how.

Keeping this post short and sweet, I think the U.S. stock market is setting up for a sharp selloff. And it will look a lot like the July 2011 correction. If my calculations are correct this will happen in the next 3-9 weeks and we will see a 15% drop from our current levels. Only time will tell, but I have a way to hedge against this with very little downside risk to you ETF portfolio.

The Dow Theory Live Example for ETF Portfolio

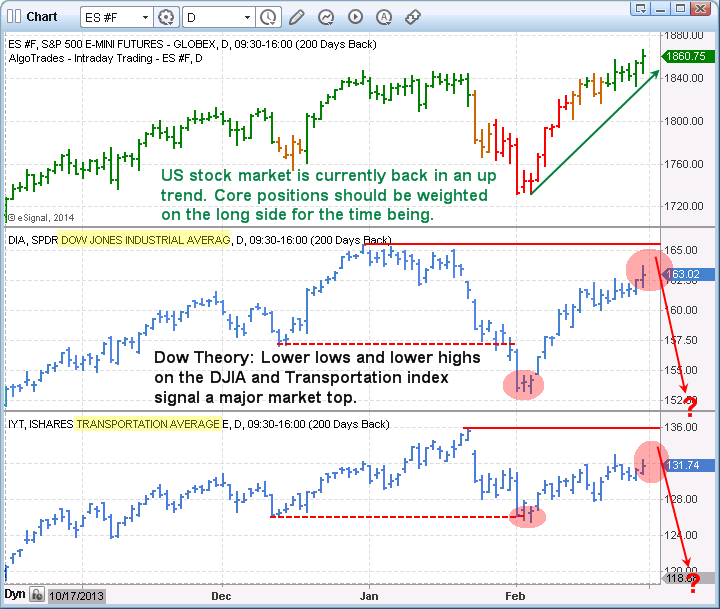
The daily chart of the SP500 index below shows our current trend analysis with green bars signaling an uptrend, orange being neutral, and red signaling bearish price action. Currently the bars are green and we can expect prices to have an upward bias.

The Dow Theory could be  in play. When both the Transports (IYT) and the Dow Jones Industrial Average (DIA) cannot make higher highs and start making lower lows, according to the Dow Theory the broad stock market is topping.

We are watching the market closely because they have both made lower highs and lows.  This rally could stall in the next couple weeks and if so we expect a 15% correction.


Model ETF Portfolio


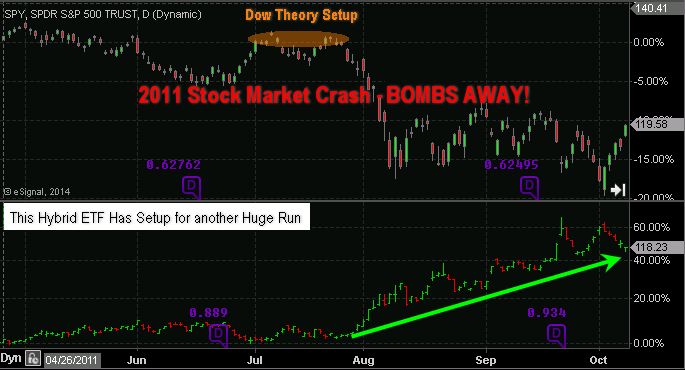
Take a look at the 2011 Stock Market Crash

Model ETF Portfolio Trading

The chart above shows how fearful traders have a delayed reaction to moving money from stocks to a mix of risk-off assets.

The choppy market condition during August and September clearly helped in frustrating investors and created more uncertainty. This helped prices of this ETF portfolio fund rally long after the initial selloff took place. This is something I feel will take place again in the near future and subscribers of my ETF newsletter will benefit from this move.

Because we have a Dow Theory setup, our risk levels are clearly defined as to when to exit the trade if it does not play out in our favor. But with the potential to make 40% and the downside risk only being 4%, it’s the perfect setup for a large portion of our ETF portfolio. And just so you know this is not a precious metals trade as we are already long that sector and up 10% in that position already.

Get My Daily Video Forecasts & ETF Trades Today


Chris Vermeulen
The Gold & Oil Guy.com


Wednesday, May 15, 2013

How to Spot & Time Stock Market Tops

Since the middle of April everyone and including their grandmother seems to have been building a short position in the equities market and we know picking tops or bottoms fighting the major underlying trend is risky business but most individuals cannot resist.

The rush one gets trying to pick a major top or bottom is flat out exciting and that is what makes it so darn addicting and irresistible. If you have ever nailed a market top or bottom then you know just how much money can be made. That one big win naturally draws you back to keep doing it much like how a casino works. The chemicals released in the brain during these extremely exciting times are strong enough that even the most focused traders fall victim to breaking rules and trying these type of bets/trades.

So if are going to try to pick a top you better be sure the charts and odds are leaning in your favor as much as possible before starting to build a position.

Below are a few charts with my analysis and thoughts overlaid showing you some of the things I look at when thinking about a counter trend trade like picking a top within a bull market.

Utility Stocks vs SP500 Index Daily Performance Chart:

The SPY and XLU performance chart below clearly shows how the majority of traders move out of the slow moving defensive stocks (utilities – XLU) and starts to put their money into more risky stocks. This helps boost the broad market. I see the same thing in bonds and gold this month which is a sign that a market top is nearing.

That being said when a market tops it is generally a process which takes time. Most traders think tops area one day event but most of the times it takes weeks to unfold as the upward momentum slows and the big smart money players slowly hand off their long positions to the greedy emotion drove traders.

Look at the chart below and notice the first red box during September and October. As you can see it took nearly 6 weeks for that top to form before actually falling off. That same thing could easily happen again this time, though I do feel it will be more violent this time around.

SPYXLU

SPY ETF Trading Chart Shows Instability and Resistance:

Using simple trend line analysis we see the equities market is trading at resistance and sideways or lower prices are more likely in the next week or two.

SPYResistance

Stocks Trading Above 150 Day Moving Average Chart:

This chart because it’s based on a very long term moving average (150sma) is a slow mover and does not work well for timing traded. But with that said it does clearly warn you when stocks are getting a little overpriced and sellers could start at any time.

General rule is not to invest money on the long side when this chart is above the 75% level. Rather wait for a pullback below it.

BarC150

Stocks Trading Above 20 Day Moving Average Chart:

This chart is based on the 20 day moving average which moves quickly. Because it reacts quicker to recent price action it can be a great help in timing an entry point for a market top or bottom. It does not pin point the day/top it does give you a one or two week window of when price should start to correct.

BarC20

How to Spot and Time Stock Market Tops Conclusion:

As we all know or will soon find out, trading is one of the toughest businesses or and one of the most expensive hobbies that one will try to master. Hence the 95-99% failure rate of individuals who try to understand how the market functions, position management, how to control their own emotions and to create/follow a winning strategy.

With over 8000 public traded stocks, exchange traded funds, options, bonds, commodities, futures, forex, currencies etc… to pick from its easy to get overwhelmed and just start doing more or less random trades without a proven, documented rule based strategy. This type of trading results in frustration, loss of money and the eventual closure of a trading account. During this process most individuals will also lose friends, family and in many cased self confidence.

So the next time you think about betting against the trend to pick a top or a bottom you better make darn sure you have waited well beyond the first day you feel like the market is topping out. Stocks trading over the 150 and 20 day moving averages should be in the upper reversal zones and money should be flowing out of bonds and other safe haven/defensive stocks to fuel the last rally/surge higher in the broad market.

Also I would like to note that I do follow the index futures and volume very closely on both the intraday and daily charts. This is where the big money does a lot of trading. Knowing when futures contracts are being sold or bought with heavy volume is very important data in helping time tops and bottoms more accurately. And the more experience you have in trading also plays a large part in your success in trading tops and bottoms.

Download our FREE eBook on Controlling Your Trades, Money & Emotions


And join our FREE Newsletter Today!

Monday, May 6, 2013

Stocks Preparing for Pullback, Buy Bad News, Sell the Good

The SP500 remains in a strong uptrend, but the index has posted a sizable gains for 2013 thus far so it’s only logical that a pullback within this bull market takes place sooner than later.

With May now upon us and historically prices fall more times than not we feel a 3-4 weeks correction is on the verge of starting. This Friday we just had very strong economic numbers confirming the economy is recovering. This news has sent stocks sharply higher as shorts cover their positions and investors who are not yet long get into position to profit from higher prices. But the herd psychology and their trades are typically incorrect as they invest based on fear and greed. The old saying is buy on negative news and sell on positive news will typically get you on the correct side of the market more times than not if used with price, volume and cycles.

The Technical Traders – SP500 Index Weekly Chart

If we look at the price of the SP500 we need it to breakdown below the recent pivot low before we become bearish. Volume which is not shown on this chart is below average as price moves higher and this is a bearish sign also.

Looking at a basic cycle using the stochastics indicator we can see that the current cycle is starting to turn down. Cycles tend to lead price during an uptrend so we could still have stocks move higher for another week or so but be aware that when price starts to drop its likely a market top. But until then you must respect the uptrend. Stocks can remain overbought and toppy looking for months… so done be gambling and trying to pick a top until we see breakdown start.

spy2

SP500 Stocks Trading Above 200 Moving Average – The Technical Traders View

Stocks trading above the 200 day moving average is a great indicator for helping spot broad market underlying strength/weakness. It does lag the market but is still very powerful. The chart below shows this info and my thinking of what is likely to unfold sooner than later though price may still rise for several days yet.

We also use a similar chart for timing swing trades and market tops which are based on stocks trading above the 20 day moving average. This chart is not shown here but is now trading at a level which generally triggers selling/market top.

spy1

Stock Market and SP500 Trading and Investing Conclusion:

In short, we are still bullish on the market as we focus on trading with the trend. We do not pick market tops and we do not pick market bottoms. Knowing that stocks make their biggest moves at the end of their uptrend and at the end of a down trend it’s only common sense that risk is extremely high if you are betting against the current trend.

The best thing to do is wait for a technical breakdown and reversal which puts the odds more in your favor with much less risk and typically a clear line in the sand to exit the position if you are incorrect.

The last major stock market top which formed in September of last year had a series of strong news and strong price action persuading the herd to buy stocks. Instead it was the last impulse wave up just before a strong correction took place. That is much like what we see now with the economic news.

Join our free newsletter and stay on right side of the market while reducing your trading/investing stress. My simple yet effective analysis walks you through the market each week without bias. Remember Price and Volume is what makes you money trading NOT news or forecasts.

Join our FREE Newsletter Today!


Check out our current specials for full subscription members.