Showing posts with label Crude Oil. Show all posts

Wednesday, December 26, 2018

The SP500 Breaks 2018 February Lows - What Next?

The ES (S&P e-mini contracts) broke the support level from the February 2018 lows immediately after the US Federal Reserve announced a 25 bp rate hike this week. This breakdown below the February 2018 lows is concerning because it indicates that previous support is not holding and we could be in for further downside price activity.


We are preparing a detailed research post for early next week regarding a broad range of US markets as well as how our proprietary price modeling systems are reflecting this recent price move. What we can suggest to all investors is play small positions at the moment and prepare for increased volatility. There is near term support that may come into play soon, but overall the markets are reacting to a deleveraging event that could see prices push below 2400 before finding true support.

Visit The Technical Traders to read all of our recent research posts and see what we believe will be the big movers in 2019.

Chris Vermeulen


Stock & ETF Trading Signals

Wednesday, December 19, 2018

ES Sets Up Major Double Bottom Ahead of the Fed

The downside price rotation in the U.S. markets on Monday, December 17, set up a near perfect double bottom formation near the 2530 price level and also prompted a dramatic price recovery after reaching these lows. Currently, the ES has rallied over 35 pts from this low level and will likely pause before the Fed minutes are announced on Wednesday, December 19.

If the Fed holds true to their earlier promises of continued rate increases, we could see this 2530 level broken as price retreats from any relief rally and attempts to find lower support. If the Fed changes the context of their message and adopts a slower and more insightful rate policy, the markets are poised for one heck of a potential rally. The ES if down by a little more than 400 points (-13.75%) from the peak in September 2018.

Check Out Our 3 Hour Trading Strategy Mastery Video 

We believe the markets have already priced in the expected Fed rate hike and we believe an additional rate hike could become a catalyst for a downside move towards 2300 if the 2530 level is breached. We would like to see the Fed pause, or even decrease rate levels by 25 bp, allowing the markets to parse through the credit/debt issues that have started to plague the global markets before it causes the markets to “turn turtle” and prompt a greater crisis event.


Some of our earlier research, from 2013-2014, was a modeling system dedicated to the Fed interest rates, GDP, Population and Asset Valuations. We modeled various outcomes of the global economy over the future 15 to 20 years including massive debt increases, massive debt decreases, slowing GDP, growing GDP, massive changes in population and asset levels and many others. Overall, our research showed that the 2% Fed Funds Rate level should have been an upper boundary and should have been a near term target back in 2015-2016. As or right now, the Fed should be decreasing rates to allow for a smooth transition through a “deleveraging process”.

The Fed is behind the curve and is failing to properly navigate the future outcomes of global assets, debt and credit cycles. If the US Fed is not cautious over the next 12+ months with how they manage the FFR, they could push the entire global economy over a cliff faster than they can spell “Powell”.

Everything rests on Wednesday, December 19 and the U.S. Fed at this point. Our predictive modeling systems are still suggesting we should see strong upside price activity throughout the end of this year and early next year – assuming the Fed does not pull the floor out from under this market and capsize the global credit markets again.

Learn how we can help you find and execute trades for better success. Our analysis has been well ahead of these market moves for months and we’ve nailed some incredible trades.

Visit The Technical Traders to learn more.

Chris Vermeulen


Saturday, November 24, 2018

Crude Oil and Bitcoin Hit New Yearly Lows

For the first time in a year WTI crude oil is traded below $54 a barrel hitting a low of $53.63. Oil fell as much as 6% as fears are surfacing that OPEC's planned production cuts will do little to stave off a surge in global stockpiles.

Bitcoin finally made a significant move to break out of the tight trading range that it had been trapped in. Unfortunately for Bitcoin bulls, it was not the move that they were looking for as it dropped almost 13% on Monday and continued lower Tuesday shedding another 4.8% to trade at the new yearly low of $4,547.00. The cryptocurrency is now down more than 60% year to date and more than 70% since its all time high. Where will it stop? $3000, $2000 or $1000?


Not to be outdone by oil and Bitcoin, stocks are all continuing the sell off that started Monday with the S&P 500 dropping 1.6%, the DOW is once again below 25k, shedding 2% and the NASDAQ is trading back below 7,000 losing 1.6%. The recent sell off has once again pushed the stock market back below the yearly open, shedding all of the gains that came with record highs earlier in the year which has driven all three indexes into correction/bear market territory. It's looking more and more like we have a good to chance to end the year lower unless we get the Santa Clause rally.

Jeremy Lutz
INO/MarketClub


Saturday, October 13, 2018

Will Crude Oil Follow These Historical Patterns?

Our research team and partners at Technical Traders Ltd., has been very interested in crude oil recently as the current rally appears to have rotated lower near a top. Our predictive modeling systems, predictive cycle analysis and other tools suggest Oil/Energy may be setting up for a downward price trend. This may be an excellent opportunity for skilled traders to identify profitable trades as this trend matures.

This Daily Crude Oil Chart shows our Predictive Cycle Modeling system and shows the projected price cycles out into the future. One can see the downside projected price levels very clearly. This cycle analysis tool does not predict price levels, it just predicts price trends. We can’t look at this indicator and think that $72 ppb is a price target (near the right side). We can only assume that a downward price cycle is about to hit and use historical price as a guide to where price may attempt to fall to.


Using our adaptive Fibonacci price modeling tool, we can see from the chart below that downside price targets are currently near $72 ppb, $67 ppb and $65 ppb. Therefore, we believe the $72 price level will become the first level of support, where our price cycle tool suggests a small rotation may occur, and the $67 price level may become the ultimate downside target level.


We believe the current price rotation in Oil/Energy may be setting up for a decent downside price move with a lower price target at or below $67 ppb. Historical data shows that this type of price action, downward, at this time is historically accurate and predictable. If you want to know how you can profit from this move and learn how our research team continues to find and execute superior trades for our members, visit The Technical Traders to learn more.

Chris Vermeulen


Sunday, May 13, 2018

How Congestion Basing Can Present Incredible Opportunities

Our research team here at the Technical Traders wanted to alert our followers to the incredible opportunities that continue to present themselves in the current market. While many people have been overly concerned about a market top and price rotation in the US majors, the Energy sector and many others have seen incredible price moves.

Take a look at this XLE chart as an example. Yes, we know that Oil has rallied from about $60 to closer to $70 recently, yet we want you to focus on the price pattern that setup this move in XLE. Specifically, we want you to focus on the Multi-Month Base pattern in price between early February and early April of 2018 as well as the upside breakout that followed.

In true technical analysis theory, price tells us everything and indicators assist us in relating current price movement/action to historical price movement/action. This simple chart illustrates how price setup a top/resistance zone near $78 in early January 2018, broke lower in early February, then setup a multi-month price support base for nearly 60+ days. This price support base because an extended bottom formation and a “price support zone” by testing and retesting the critical $65~66 price level while establishing a series downward sloping high price peaks. When it finally broke free of this support zone, near mid-April, price skyrocketed higher (+17% or more).


With the stock market showing all the signs that it is in the late stage of a bull market this is when traders need to start identifying the hot sectors or high probability continuation patterns. Why? because we have entered a stock pickers market. It’s simple really, it means all the stocks are not going to be rising together and if you put your money into the wrong sector you could lose money while the markets rise.

So where is the next hot sector? We believe a very similar pattern is setting up in the IYT (Transportation Index) just like we saw on the first chart of the XLE. We feel an upside breakout move is likely to happen within the next two weeks.

The setup of this price pattern is a bit broader and more volatile than the XLE Multi-Month Basing pattern – which means the IYT upside breakout could be more volatile and dramatic in form (possibly driving price +10% to 20% over an extended period).

Additionally, the high price peaks are setting up in a similar format with lower high price peaks over the span of the base. Support near $182.50 to $185 is critical and we believe the eventual upside breakout will be an incredible opportunity for traders.


This breakout will coincide with much of our other analysis of the US major markets which we have been sharing recently.

Our other recent trade alerts, that are up well over 10% each are UGAZ, FAS, and TECL. These have been rocketing higher – as we predicted. On Friday we closed our TECL position which hit our resistance level and we locked in the 18.3% gains with our members. The single point of success for all of us is to manage our assets well in an attempt to achieve greater long-term success.

If you have not seen or read much of our recent analysis, please visit The Technical Traders to learn more and review our work. Our exclusive members are already positioned for many moves like this in the markets and more continue to form each week.

We urge you to consider joining our Wealth Building Trading Newsletter as a member to receive our incredible insight, proprietary research, and trade alerts to assist your own trading success. We have delivered insights and research to our members that have clearly informed them of where we believe the markets are headed for many months in advance. Imagine how powerful that kind of research could be for you?

53 years experience in researching and trading makes analyzing the complex and ever-changing financial markets a natural process. We have a simple and highly effective way to provide our customers with the most convenient, accurate, and timely market forecasts available today. Our stock and ETF trading alerts are readily available through our exclusive membership service via email and SMS text. Our newsletter, Technical Trading Mastery book, and 3 Hour Trading Video Course are designed for both traders and investors. Also, some of our strategies have been fully automated for the ultimate trading experience.

Chris Vermeulen

Stock & ETF Trading Signals


Thursday, November 26, 2015

New Video: John Carter's Proven Strategies for Q4 and 2016


There are very few traders that have as unique of a story as our friend and trading partner John Carter. From watching his dad place his trades as "hand draws" to becoming a successful trader himself. It wasn't an easy path he took.

There have been lots of bumps, direction changes, and heartbreak along the way. But through time John has learned that if you want to have a 6 figure trading account like his, options are your best way to get there.

Today John is sharing with us his latest free video that will give us an insight into how he will be using options to close out the year and moving forward into 2016.

WatchJohn's Proven Strategies for Q4 and 2016

In this FREE video from John will give you two proven strategies he's using in 2016 that are sure to work for you. Now, when a trader like John Carter says "hey, here are my two best strategies" you'd be nuts not to at least hear him out and see if it can be applied to what you are doing.

So click here for his best two 2016 strategies

And here's what else he's showing you in this free video:

  *  His two proven Strategies John used to make 30k last week!

  *  How to make and find successful trades from your phone

  *  How to Successfully Trade 2016 Economic Disasters

  *  How to find trades that won't run your stops

John even shows you exactly what he's currently trading. This is my favorite part.....just watch!

See you in the markets putting this to work!
Hedge Fund University


While you are here get John's latest FREE eBook "Understanding Options"....Just Click Here!


Sunday, June 22, 2014

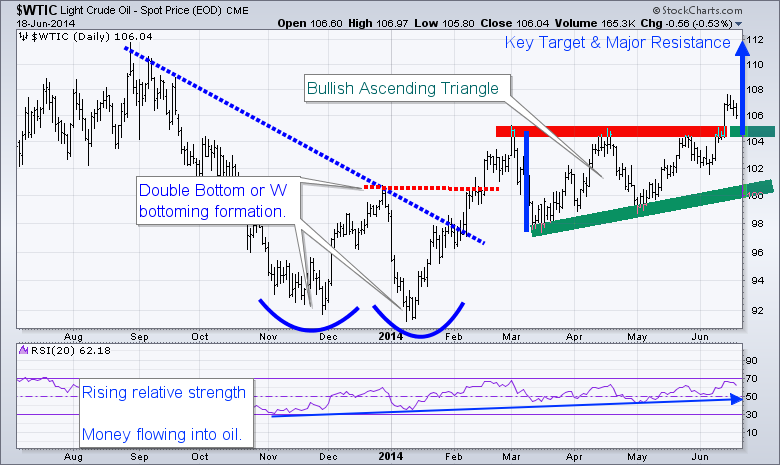
WTI Crude Oil on the Move $112 Next Stop

HFU staffer member Chris Vermeulen, the Gold & Oil Guy, brings us his bullish call on the next move in WTI crude oil.......

The energy sector has surged during the last two months which can be seen by looking at the XLE Energy Select Sector Fund. If crude oil continues to climb to the $112 level, XLE will likely continue to rally for another few days or possibly week as energy stocks are considered a leveraged way to play energy price movements.

Another way to look at this info is through the USO United States Oil Fund. This tracks much closer to the price of oil. The only issue is that many ETFs that “try to track” an underlying commodity is in how the funds are built. They own multiple contracts further into the future which does not exactly provide us with the short term news/event driven price movements in the current front month contract as they should.

What does this mumbo jumbo mean? Well, it means funds like USO and the highly respected UNG, and VIX ETFs… (just joking about the highly respected part), fail to track the underlying commodity or index very well when it comes to short term price movements. This means, you can nail the timing of a trade, and the commodity or index will move in your favor, yet your fund loses money, or goes nowhere...

Let’s Focus on the Technicals Now….


WTI crude oil has formed a bullish ascending triangle pattern from March to May of this year. The breakout to the upside is bullish and should be traded that way until the chart says otherwise. This breakout and first pullback must hold, or I will consider it a failed breakout. So if price dips and closes 2 days below the breakout level, it will be a major negative for oil in my opinion.

The range of the ascending triangle provides us with a measured move to the upside which is $112. Typically the first pullback after a breakout can be bought. The first short term target to scalp some gains would be $109, and at that point moving your stop to breakeven is a wise decision. Trading is all about managing capital and risk, if you don’t, then the market will take advantage of your lack in discipline.

Looking further back on the chart, you can see the double bottom formation also known as a “W” formation. Once the high of the “W” formation is broken the trend should be considered neural or up.

Also note that the RSI (relative strength) has been trending higher for some time now. This means money is rotating into this commodity. This is in line with my interview this week with Kerry Lutz and my recent article talking about the next bull market in commodities and the TSX (Toronto Stock Exchange).

clfutures


WTI Crude Oil Trading Conclusion:


In short, oil has some extra risk around it. The recent move has been partly fueled by news overseas. So at any time oil could get a lift or take a hit by news that hits the wires. I tent to trade news related events with much less capital than I normally do because of this risk.

Happy Trading,
Chris Vermeulen

WANT MORE TRADE IDEAS? GET THEM HERE: THE GOLD & OIL GUY.COM


Thursday, June 5, 2014

Mining and the Environment — Facts vs. Fear

By Laurynas Vegys, Research Analyst

“I would NEVER invest in a mining company—they destroy land, pollute our water and air, and wreck the habitat of plants and animals.”


These were the points made to me by a woman at a social gathering after I told her what I do for living. She prided herself on her moral high ground and looked upon me with obvious disdain. It was clear that as a mining researcher, I was partly responsible for destroying the environment.

I knew a reasonable discussion with her wouldn’t be possible, so I opted out of trying. (As Winston Churchill said, “A fanatic is one who can’t change his mind and won’t change the subject.”) She left the party convinced her position was indisputably correct. But was she?

Not at all.

In fact, with few exceptions, today’s mining operations are designed, developed, operated, and ultimately closed in an environmentally sound manner. On top of that, considerable effort goes into the continued improvement of environmental standards.

My environmentalist acquaintance, of course, would loudly disagree with those statements. Many people may feel uncomfortable investing in an industry that’s so closely scrutinized and vehemently criticized by the public and mainstream media—whether there’s good reason for that criticism or not. This actually is to the benefit of those who dare to think for themselves.

So let’s examine what mining REALLY does to the environment. As Doug Casey always says, we should start by defining our terms…

How Do You Define “Environment”?

In modern mining, the term “environment” is broader than just air, water, land, and plant and animal life. It also encompasses the social, economic, and cultural environment and, ultimately, the health and safety conditions of anyone involved with or affected by a given mining activity.

Armed with this more comprehensive view of the industry’s impact on the environment, we can evaluate the effects of mining and its benefits in a more holistic fashion.

Impact on the Economy

According to a study commissioned by the World Gold Council, to take an example from mining of our favorite metal, the gold mines in the world’s top 15 producing countries generated about US$78.4 billion of direct Gross Value Added (GVA) in 2012. (GVA measures the contribution to the economy of each individual producer, industry, or sector in a country.) That sum is roughly the annual GDP of Ecuador or Azerbaijan, or 30% of the estimated GDP of Shanghai, China. Here’s a look at the GVA for each of these countries.


Keep in mind that this doesn’t include the indirect effects of gold mining that come from spending in the supply chain and by employees on goods and services. If this impact were reflected in the numbers, the overall economic contribution of gold mining would be significantly larger. Also, it’s evident that gold mining’s imprint on national economies varies considerably. For countries like Papua New Guinea, Ghana, Tanzania, and Uzbekistan, gold mining is one of the principal sources of prosperity.

Another measure of economic contribution is the jobs created and supported by businesses. The chart below shows the share of jobs created of each major gold-producing country.


The four countries with the highest numbers of gold mining employees are South Africa (145,000), Russia (138,000), China (98,200), and Australia (32,300). The industry also employs 18,600 in Indonesia, 17,100 in Tanzania, and 16,100 in Papua New Guinea. (As an aside, it’s quite telling that South Africa employs more gold miners than China, but China produces more gold than South Africa.)

Note that these employment figures don’t include jobs in the artisanal and small-scale production mining fields, or any type of indirect employment attributable to gold mining—so they understate the actual figures
For many countries, gold mining accounts for a significant share of exports. As an example, gold merchandise comprised 36% of Tanzanian and 26% of Ghana’s and Papua New Guinea’s exports in 2012.

Below, you see a more comprehensive picture of gold exports by 15 major gold-producing countries.


Other, often overlooked ways in which the mining industry supports the economy include:
  • Foreign Direct Investment (FDI). The three mining giants—Canada, the United States, and Australia—have been dominating this category for a number of years, both as the primary destinations for investment and as the main investor countries.
  • Government revenue. All mining businesses, regardless of jurisdiction, have to pay certain levies on their revenue and earnings, including license fees, resource rents, withholding and sales taxes, export duties, corporate income taxes, and various royalties. Taken all together, these payments make up a large portion of overall mining costs. For example, estimates suggest that the total of mining royalty payments in 2012 across the top gold-producing countries worked out to the tune of US$4.1 billion. This, of course, doesn’t account for other types of tax normally applied to the mining industry.
  • Gold products. Gold as a symbol of prosperity and the ultimate “wealth insurance” is very important to many nations around the globe—especially in Asia and Africa. Gold jewelry is given as a dowry to brides and as gifts at major holidays. In India, the government’s ban on gold purchases by the public led to so much smuggling that the incoming prime minister is considering removing it. Chinese, Vietnamese, and peoples of India and Africa may all be divided across linguistic lines, but they all share the view of gold being a symbol of prosperity and ultimate insurance against life’s uncertainties.
It’s also important to note that jobs with modern mining companies are usually the most desirable options for poverty stricken people in the remote areas where many mines are built. These jobs not only pay more than anything else in such regions, they provide training and health benefits simply not available anywhere else.
Mining provides work with dignity and a chance at a better future for hundreds of thousands of struggling families all around the world.

Let’s now have a look at the most debated and contentious side to mining.

Impact on the (Physical) Environment

In previous millennia, humans labored with little concern for the environment. Resources seemed infinite, and the land vast and adaptable to our needs. An older acquaintance of ours who grew up in 1930s Pittsburgh remembers the constant coal soot hanging in the air: “Every day, it got dark around noon time.” Victorian London was famous for its noxious, smoky, sulfurous fog, year round.

Initially, the mining industry followed the same trend. Early mine operations had little, if any, regard for the environment, and were usually abandoned with no thought given to cleaning up the mess once an ore body was depleted.

In the second half of the 20th century, however, the situation turned around, as the mining industry realized the need to better understand and mitigate its impact on the environment.

The force of law, it must be admitted, had a lot to do with this change, but today, what is sometimes called “social permitting” frequently has an even more powerful regulatory effect than government mandates. Today’s executives understand that good environmental stewardship is good business—and many have strong personal environmental ethics.

That said, mining is an extractive industry, and it’s always going to have an impact. Here’s a quick look at some of the biggest environmental scares associated with gold mining and how they are confronted today.

Mercury Symbol: Hg Occurrence in the earth’s crust: Rare Toxicity: High

Mercury, also known as quicksilver, has been used to process gold and silver since the Roman era. Mercury doesn’t break down in the environment and is highly toxic for both humans and animals. Today, the use of mercury is largely limited to artisanal and illegal mining. Industrial mining companies have switched to more efficient and less environmentally damaging techniques (e.g., cyanide leaching).

Developing countries with a heavy illegal mining presence, on the other hand, have seen mercury pollution increase. The United Nations Industrial Development Organization (UNIDO) estimates that 1,000 tons of mercury are annually released into the air, soil, and water as a result of illegal mining activity.

To help combat the problem, the mining industry, through the members of the International Council on Mining & Metals (ICMM), has partnered with governments of those nations to transfer low- or no-mercury processing technologies to the artisanal mining sector.

Sodium Cyanide Mining compound employed: NaCN Occurrence in nature: Common Toxicity: High

This is one of the widely used chemicals in the industry that can make people’s emotions run high. Historically considered a deadly poison, cyanide has been implicated in events such as the Holocaust, Middle Eastern wars, and the Jonestown suicides. Given such associations, it’s no wonder that the public perceives it with alarm, without even adding mining to the equation.

It is important, however, to understand that cyanide:
  • is a naturally occurring chemical;
  • is not toxic in all forms or all concentrations;
  • has a wide range of industrial uses and is safely manufactured, stored, and transported every day;
  • is biodegradable and doesn’t build up in fish populations;
  • is not cumulative in humans and is metabolized at low exposure levels;
  • should not be confused with Acid Rock Drainage (ARD; see below); and
  • is not a heavy metal.
Cyanide is one of only a few chemical reagents that dissolves gold in water and has been used to leach gold from various ores for over a hundred years. This technique—known as cyanidation—is considered a much safer alternative to extraction with liquid mercury, which was previously the main method used. Cyanidation has been the dominant gold extraction technology since the 1970s; in Canada, more than 90% of gold mined is processed with cyanide.

Despite its many advantages for industrial uses, cyanide remains acutely toxic to humans and obviously is a concern on the environmental front. There are two primary environmental risks from gold cyanidation:
  • Cyanide might leach into the soil and ground water at toxic concentrations.
  • A catastrophic spill could contaminate the ecosystem with toxic levels of cyanide.
In response to these concerns, gold mining companies around the world have developed precautionary systems to prevent the escape of cyanide into the environment—for example, special leach pads lined with a plastic membrane to prevent the cyanide from invading the soil. The cyanide is subsequently captured and recycled.

Further, to minimize the environmental impact of any cyanide that is not recycled, mine facilities treat cyanide waste through several processes that allow it to degrade naturally through sunlight, hydrolysis, and oxidation.

Acid Rock Drainage (ARD) Target chemical: Sulfuric acid ARD occurrence in nature: Common Toxicity: Varies

Contrary to popular belief, ARD is the natural oxidation of sulfide minerals such as pyrite when these are exposed to air and water. The result of this oxidation is an increase in the acidity of the water, sometimes to dangerous levels. The problem intensifies when the acid comes into contact with high levels of metals and thereby dissolves them, which adds to the water contamination.

Once again, ARD is a natural process that can happen whenever such rocks are exposed on the surface of the earth, even when no mining was involved at all. Possible sources of ARD at a mine site can include waste-rock piles, tailings storage facilities, and mine openings. However, since many mineral deposits contain little or no pyrite, ARD is a potential issue only at mines with specific rock types.

Part of a mining company’s environmental assessment is to conduct technical studies to evaluate the ARD potential of the rocks that may be disturbed. Once ARD has developed, the company may employ measures to prevent its spread or reduce the migration of ARD waters and perhaps even treat the water to reduce acidity and remove dissolved metals.

In some places where exposed sulfide minerals are already causing ARD, a clean, modern mine that treats all outflowing water can actually improve water quality.

Arsenic Symbol: As Occurrence in the earth’s crust: Moderate Toxicity: High

Similar to mercury, arsenic is a naturally occurring element that is commonly found as an impurity in metal ores. In fact, arsenic is the 33rd most abundant element in the earth’s crust and is present in rocks and soil, in natural waters, and in small amounts in all living things. For comparison, silver (Ag) is 47th and gold (Au) 79th (see the periodic table of elements). Arsenic is toxic in large doses.

The largest contribution of arsenic from the mining industry comes from atmospheric emissions from copper smelting. It can also, however, leach out of some metal ores through ARD and, when present, needs to be removed as an impurity to produce a saleable product.

Several pollution-control technologies have been successful at capturing and removing arsenic from smelting stacks and mine tailings. As a result, between 1993 and 2009, the release of arsenic from mining activities in Canada fell by 79%. Similar figures have been reported in other countries.

Mythbusters

Now, here’s our quick stab at dispelling the three most widespread myths environmentalists commonly bring up in their rants against the mining industry.

Myth 1: Mining Uses Excessive Amounts of Land

Reality: Less than 1% of the total land area in any given jurisdiction is allotted for mining operations (normally far less than that). Even a modest forestry project affects far more trees than the largest open-pit mine. Mining activities must also meet stringent environmental standards before a company can even get a permit to operate.

The assessment process applied to mining operations is very detailed and based on a long string of policies and regulations (e.g., the National Environmental Policy Act in the US). Environmentalists may claim that the mining industry is rife with greedy land barons, but there’s more than enough evidence to the contrary.

Myth 2: Mining Is Always Detrimental to the Water Supply

Reality: Quite the opposite, actually. Before mine operations start, a mining company must submit a project proposal that includes detailed water utility studies (which are then evaluated by scientists and government agencies). Many companies even install water supply systems in local communities that lack easy access to this basic resource. It’s also common for the rocks to be mined to be naturally acid-generating—a problem the mine cleans up, by its very nature.

Some die hard zealots blame the mining industry for consuming huge amounts of water, but in fact it normally only uses +1% of the total water supplied to a given community, and 80% of that water is recycled continuously.

Myth 3: Mining Is Invasive to the Natural Environment

Reality: Yes, mining activity in certain countries has led to negative outcomes for certain plants and animals—not to mention the rocks themselves, which are blasted and hauled away. However, the industry has progressed a long way in the last few decades and, apart from rare accidents, the worst is behind us now.

The key determinant here is compliance. All mining activity must comply with strict environmental guidelines, leading up to and during operations and also following mine closure. After mining activity ends, the company is required to rehabilitate the land. In some cases, the land is remediated into forests, parks, or farmland—and left in better condition than before.

It’s worth reiterating that in some cases—where there’s naturally occurring ARD or where hundreds of years of irresponsible mining have led to environmental disasters—a modern mine is a solution to the problem that pays for itself.

Can You Be Pro-Mining and an Environmentalist? Absolutely.

Gold mining (and mining in general) is extractive and will always leave some mark on our planet. Over time, however, the risks have been mitigated by modern mining technologies. This is an ongoing process; even mining asteroids instead of planet Earth is now the subject of serious consideration among today’s most visionary entrepreneurs.

Meanwhile, the (vastly diminished) risks associated with mining are far outweighed by the economic contribution and positive effects on local communities and the greater society. This net positive contribution is here to stay—unless our civilization opts for collective suicide by sending us all back to the Stone Age.

Right now, gold and gold stocks are so undervalued that you can build a sizable portfolio at a fraction of what you would have had to spend just a few years ago. To discover the best ways to invest in gold, read Casey Research’s 2014 Gold Investor’s GuideGet it for Free Here.

The article Mining & Environment—Facts vs. Fear was originally published at Casey Research


Sign up for one of our Free Trading Webinars....Just Click Here!


Wednesday, June 4, 2014

Investing in China....Looking at the Middle Kingdom with Fresh Eyes

By John Mauldin

I am writing this introductory note from London during a layover on my way to Rome, and I’ll append a personal ending tonight after I finally make my way back from dinner to the hotel.

One of the few consensus ideas that I took away from the Strategic Investment Conference is that China has the potential to become a real problem. It seemed to me that almost everyone who addressed the topic was either seriously alarmed at the extent of China’s troubles or merely very worried. Perhaps it was the particular group of speakers we had, but no one was sanguine. If you recall, a few weeks back I introduced my young colleague and protégé Worth Wray to you; and his inaugural Thoughts from the Frontline focused on China, a topic on which he is well versed, having lived and studied there. Our conversations often center on China and emerging markets (and we tend to talk and write to each other a lot). While I’m on the road, Worth is once again visiting China in this week’s letter, summing up our research and contributing his own unique style and passion. I think regular TFTF readers are going to enjoy Worth’s occasional missives and will want to see more of them over time. Now, let’s turn it over to my able young Cajun friend.

Editors’ note: With John up to his eyeballs in prosecco and peaches there on the patio in Trequanda this morning and with Worth just getting the sleep out of his eyes in Houston, we are hereby making an executive decision to split this 22 page beast masterpiece right up its middle and bring you the second half next week … which will give both these guys some well earned rest!  – Charley & Lisa Sweet

Looking at the Middle Kingdom with Fresh Eyes

By Worth Wray (Houston, TX)
In my Thoughts from the Frontline debut this past March (“China’s Minsky Moment?”), I highlighted the massive bubble in Chinese private sector debt and explored the near term prospects for either (1) a reform induced slowdown or (2) a crisis induced recession. Unfortunately, it was not an easy or straightforward analysis, considering the glaring inconsistencies between “official” state compiled data and more concrete measures of real economic activity.

More Questions Than Answers

Although John and I spend hours every week searching for the truth in a murky stream of official and unofficial reports, we always reach the same conclusion about the People’s Republic: There is really no way to know what is happening in China today, much less what will happen tomorrow, based on widely available data. The primary data is flawed at best and manipulated at worst. Sometimes the most revealing insights lie in the disagreement between the official and unofficial reports… suggesting that official data is useful only to the extent that we think about it as state-sanctioned propaganda. In other words, it tells us what Chinese policymakers want the world to believe.

This shortfall in credible and actionable data from one of the global economy’s largest and most interconnected members leaves us with more questions than answers – especially in the presence of a massive Chinese credit bubble, with clear signs of overinvestment and unsustainably high debt-service ratios. These are troubling signs for all investors, in every asset class, everywhere in the world today… and everyone should be paying close attention.

(I should note that John has access to a massive amount of research from a very wide variety of both traditional and nontraditional sources… and I say that after having extraordinary access myself as the portfolio strategist for an $18B Texas money manager. I am seeing and reading things every day that I could only imagine before, and the information flow is addictive. John’s sources give us a big, if sometimes overwhelming, head start on thinking through all the implications for investing around the constant collisions of macroeconomic forces. While we legally and ethically cannot share some of the best research we see, we can share a lot of the core ideas and do our best to give you a head start, too. That’s what this letter is about.)

Read the Tea Leaves Carefully & Expect Miscues

Most China economists – who do the best they can to read the economic tea leaves by focusing on a handful of economic indicators ranging from gross domestic product (GDP), purchasing managers’ indices (PMI), consumer/producer inflation (CPI/PPI), total social finance, and industrial production – end up expressing a rather bipolar view on Chinese economic activity, with wild swings in their outlooks from quarter to quarter.

On this front, I was particularly impressed by an explosive letter (viewable by Over My Shoulder subscribers only) from our friends at Political Alpha, which remains one of the elite political intelligence/analysis firms on the Street. While China watchers tend to trade reactively around official and unofficial manufacturing PMI releases as monthly proxies for the broader economy, very few investors realize that “not only is manufacturing no longer the bellwether of the [Chinese] economy, more often than not it now performs counter cyclically.”

Although China is the world’s largest producer of value added manufactured goods, it has not been an export led economy for a very long time. As I detailed in last month’s letter, China’s growth has largely relied on extraordinarily high levels of fixed investment, supported by even higher levels of domestic savings and an unsustainable rise in private sector credit.


Source: Wayne M. Morrison, China’s Economic Rise: History, Trends, Challenges, & Implications for the United States. Congressional Research Service, February 3, 2014

Even so, industry experts often fall into the trap of extrapolating flash manufacturing readings into forecasts for the broader economy.

Our friends at Political Alpha describe one such situation where HSBC’s China team (which puts out the unofficial monthly PMI each month in partnership with MarkIt) “was forced to backpedal from its September 23rd announcement that the flash PMI data was ‘further evidence [of] China’s ongoing growth rebound’ to a much more somber conclusion just seven days later: ‘There are still a lot of structural headwinds ahead. This is as good as it gets for the time being…. [D]on’t expect too sharp an acceleration from here."

Feel free to compare the clips yourself:

On a side note, I don’t mean to disparage the China research team at HSBC or question their competency by reprinting the comments above. I’m sure they get up each morning (just like I do) with a genuine intent to understand changing economic conditions as best they can and to help their clients protect and grow their savings. If anything, this example is a broader indictment of investors’ widespread reliance on a handful of flawed or misunderstood data points in the absence of credible Chinese economic data.

I don’t mean to be cute or coy on this issue. The lack of transparency of the Chinese economy is not just a problem for individual and institutional investors who make the choice every day to put their money at risk; it also carries enormous policy implications for central bankers and elected politicians in a highly unstable global system where total debt-to-GDP has risen across the world’s major economies by nearly 35% since 2008… and continues to rise.


Source: Hoisington Investment Management Company, May 2014

As you can see in the table above (which Dr. Lacy Hunt was kind enough to share with us at this year’s Strategic Investment Conference), China has seen its total debt to income ratio jump by more than 100% (another full turn of GDP) in the last five years… more debt growth than any other major economy on the planet, including Japan.

Pulling Back the Bamboo Curtain 

Fortunately, my last letter on China’s debt build up sparked a flurry of introductions and fresh conversations with investors, economists, and policymakers from around the world – in places like London, Spain, South Africa, Singapore, Dubai, Australia, Hong Kong, and Finland. Of course, John has also eagerly introduced me to many of his close friends (who happen to be serious A-list economists and money managers)… so needless to say, it has been an incredibly fun and enlightening couple of months.

But John introduced me to one man, in particular, who was able to pull back the curtain on the Chinese economy in a way I had not imagined… and it feels like I am looking at the Middle Kingdom with fresh eyes.
Meet Leland Miller, President of China Beige Book International. Along with Dr. Craig Charney, who oversees the firm’s vast research efforts, Leland spearheads the effort to supply the world’s elite institutions (from central banks and heads of state to multinationals, mega banks, and hedge funds) with a comprehensive look into China’s economy, by applying the same survey methodology employed by each of the regional U.S. Federal Reserve Banks in preparing their submissions for the national Beige Book. 

Aside from the fact that Leland is an Oxford-educated China historian, a brilliant economist, and a genuinely nice guy, what first caught my attention was his remarkable track record of contrarian calls since the inaugural issue of the China Beige Book in Q1 2012… from the initial slowdown; to unexpected bounces in economic activity; and even the June 2013 cash crunch where interbank interest rates spiked dramatically in a matter of weeks, signaling that a wave of defaults was on the way. (I should note that John has sat on China Beige Book International’s advisory board and has worked closely with Leland for most of the firm’s history.)
Before we proceed, here is a short but important description of the history and methodology behind the China Beige Book. Although survey data has its limits in any economy, this is as good as it gets for a semi-closed economy like China’s.

Beginning in early 2010, our team set out to craft a Chinese analogue of the US Federal Reserve’s Beige Book. Over the next twelve months, we conducted a study of the Beige Book and the methods used to prepare it, including contact with officials at each of the regional Federal Reserve Banks involved in its preparation. We then worked to develop a method that would be similar, but more comprehensive and systematic, in its approach to the world’s second largest economy – a Beige Book “with Chinese characteristics.”

Our approach triangulates three methods, repeated every quarter: a quantitative survey of over 2,000 leading firms from key sectors across the country; qualitative one-on-one in-depth discussions with C-Suite executives in the same industries across every region; and a separate, targeted banker survey of loan officers and branch managers, designed to home in on the complexities of both the official and shadow economies. With the data from this approach, we are able to compare regions and industries within a quarter, as well as track changes over time, both in near and real time.
The result of these efforts is the largest and most comprehensive survey series ever conducted on a closed or semi-closed economy…

I cannot share the report in its entirety or reveal too much of its contents, but Leland did give me permission to share part of the regional overviews and research highlights from the Q1 2014 report. If you are able and willing to pay the six figure annual subscription fee, Leland’s work will blow your mind and dramatically change your perspective. For the rest of us, the following excerpt can at least point us in the right direction… and I am discovering that Leland’s media interviews and tweets (@ChinaBeigeBook) are quite telling, as well. (You can also follow John and me on Twitter at @JohnFMauldin and @WorthWray, respectively.)

China Beige Book, Regional Overview (Excerpts from the Q1 2014 report)

China Beige Book regions [listed below]
Region 1: Shanghai, Jiangsu, Zhejiang
Growth slowed – retail & real estate gains weakening sharply – despite stability in manufacturing and pickups in services, transport, and agriculture. Borrowing was stable with rates down at banks and up at non-bank lenders. Hiring slowed, as did margin growth. On quarter weakness was modest, but the on-year drop was worrisome.
Region 2: Guangdong, Fujian
Despite the national slowdown, Guangdong’s pickup continued, driven by manufacturing and transport. Growth was steady in retail, off in services and property. Wage growth remained high but costs inflation eased, boosting margins. Borrowing ticked up, with bank rates steady and shadow rates up. The export power-house found an encouraging second wind.
Region 3: Beijing, Tianjin, Shandong, Hebei
The capital region saw Q1’s worst results, due to trouble in services and manufacturing. Property and mining were stable, retail slightly better. Margin growth suffered. Borrowing was stable and moved to banks, on the country’s lowest interest rates. Beijing is leading the national economic slowdown.
Region 4: Heilongjiang, Jilin, Liaoning
The Northeast slowed as mining contracted and manufacturing, property, and farming growth eased. Services was stable and retail saw a pick-up. Hiring and wages strengthened, while pricing weakened, pressuring margins. Borrowing ticked up, rates easing. Rebalancing does not look easy in this old industrial region.
Region 5: Hubei, Henan, Chongqing, Sichuan, Anhui, Jiangxi
Growth slowed sharply, slipping in retail, services, property, farming, and mining, with only manufacturing stable. Hiring was steady but input costs grew faster, narrowing margin gains. Borrowing slid again, with lower interest rates in both formal and shadow finance – not an encouraging trend.
Region 6: Shaanxi, Shanxi, Inner Mongolia, Ningxia
Growth took a hit, gains slowing in this crucial mining sector. Manufacturing, real estate and, especially, retail weakened. Services and transport were the bright spots. Hiring and margin growth both eased. Borrowing was flat as rates went up. The North remains dependent on struggling mining.
Region 7: Guizhou, Guangxi, Yunnan, Hainan, Hunan
Again out of sync with the rest of China, the Southwest sped up. Manufacturing, transport, and mining improved, but retail, services, and real estate saw growth slow. Hiring and input costs picked up, but so did pricing and margins. Borrowing ticked up, as shadow lenders’ rates moved back above banks’ rates.
Region 8: Xinjiang, Tibet, Gansu, Qinghai
The West again boasted China’s best overall growth, though manufacturing, retail, and services slowed. Only property picked up, with mining and transport stable. Hiring and input cost growth were steady, but pricing and margin growth eased. Borrowing remained China’s least frequent as rates jumped.
China Beige Book, Research Highlights (Excerpts from the Q1 2014 report)
Manufacturing is fine, yet the economy is not
The pace of Chinese economic expansion has painfully slowed. Revenue, sales, profit, and wage growth are all weaker than a year ago. The slowdown is particularly steep in the North [region 6] and Northeast [region 4] and also pronounced in Beijing [region 3] and Central China (region 5).
By sector, stable first-quarter growth in manufacturing confirms our long-standing thesis that it is no longer the economy’s bellwether...
A bounce-back later this year is possible
The worst performer according to CBB figures, both on-quarter and on-year, is real estate and construction. While property companies are getting crushed, the sector is also notoriously unstable for both structural and political reasons. It would be no surprise if real estate were to rally before the end of the year.
More immediate reason for optimism: Growth in new domestic orders was solid (save in the Northeast), and domestic orders and export orders were both stronger in powerhouse Guangdong. The results do not indicate a boom later in 2014, but they do suggest that linear forecasts of continued deterioration are overly simplistic.
Financial segmentation is profound
The ongoing debates about monetary policy assume that anticipated loosening or tightening applies across the spectrum of borrowers. CBB data say otherwise, and in multiple ways. First, while the number of firms reporting that they borrowed stabilized in Q1, it did so at a very low level. Shoving more liquidity at the credit market will have limited effects until participation expands. This includes RRR cuts – though of course these may occur for political reasons.

Second, shadow finance may be revving up for a comeback. CBB numbers show a recovery in the sales of wealth management products (WMPs), likely due to competition from online banking. This is cash leaving the traditional banking sector and, while non-bank lending did not pick up in the first quarter, the groundwork is being laid for it to do so.
Online banking may be encouraging riskier behavior
Online lenders are typically viewed as a force for liberalization, as well as a potentially healthier alternative to unregulated shadow finance. Yet our data show their proliferation would impart significant costs as well…
What appears to be happening is the higher returns available in online banking are forcing banks to move more transactions off-balance sheet, in order to avoid the interest rate cap. While this may accommodate policy goals in the short term, an uptick in off-balance sheet funding portends more shadow bank lending down the line.
Interest rate spread between banks & shadow banks highest in a year
Bank loan rates and bond yields eased slightly this quarter, but the cost of capital increased again for those borrowing from non-bank lenders. While the shifts were not dramatic, the spread between bank and non-bank loan rates nationwide is now the largest since Q1 2013. This highlights the still more challenging road for those firms, principally domestic private entities that are pushed outside formal lending channels.

Growth Is Slowing But Not Collapsing (So Far…) 

After reading through the latest report, consulting with friends who are also familiar with the research, and bombarding Leland with a never-ending stream of questions for the last month, John and I still cannot claim to have enough information to make a directional call on the world’s most powerful (and least understood) macro force… but we know more about the inner workings of China’s economy than we did when we wrote to you a couple of months ago.

Great data often has that effect – it’s like shining a light into the shadows (including China’s shadow banks). We can see the nuanced regional contrast in economic activity, the modest (but still insufficient) rebalancing between sectors, and pressure points in the credit markets that suggest last summer’s interbank volatility may return in 2014.

We also see a far more mixed picture of economic activity than a lot of the widely followed headline data suggests. The overall pace of Chinese economic growth is clearly slowing but not collapsing. The credit transmission mechanism is obviously broken, as you can see in the chart below (with government and government-sponsored borrowers in zombie industries consuming the majority of the country’s credit… in turn forcing households to borrow through shadow banks at massive risk premiums); but so far, the credit bubble is not imploding.

On that note, China Beige Book International is the only independent research firm in the world that tracks the non-bank (shadow) lending rates not just nationally, or by region, but for every sector in every region over time. Leland and his team have essentially solved the most difficult China puzzle of all: what is true cost of capital in the Chinese economy, and who is able to actually access it?


Source: Wei Yao, “China: A whiff of debt deflation.” Societe Generale Research, May 9, 2014

Of course – and Leland was emphatic on this point – China’s greatest challenge will lie in deleveraging the economy while also rebalancing toward a consumption-driven growth model for the first time in modern history. That cannot happen as long as households remain repressed by unequal access to credit markets or intentionally suppressed exchange rates, which essentially represent a transfer of household wealth from workers to state-favored firms. But reforming the system will require a greater slowdown than China’s policymakers are letting on. And, Leland warns, Beijing runs the risk of blowing its credibility and instigating capital flight if the divergence between official forecasts and China’s actual economic experience grows too large.

To be continued next week 

Trequanda, Nantucket, New York, and Maine

It is very early Saturday morning here in Rome (still late Friday night in the US) as I finish this letter, or at least my part of it. Worth is still up and reworking this piece (I really can’t keep up with him); then the editors, Charley and Lisa Sweet, will do their final runs; and then a whole team will make sure you get your letter. A far cry from the early days when your humble analyst did everything. And the mistakes I made showed up in print far more often. I am grateful to have a whole group of dedicated people working to keep the machine humming.

In a few hours I will meet George Gilder at the train station. I will buy a few local phones (I already have local sim cards for the iPads from the airport yesterday), find some cash, and have lunch before we hop the train to Chiusi with my daughter Melissa and some friends and then meet Tiffani and Lively, who are already there with the cars. We’ll drive to Sinalunga to shop for groceries and other stuff for the week before going the last short leg to Trequanda.

Other guests will come and go over the next few weeks, using the villa as a base to explore the Tuscan region; but I will probably stay “home,” reading and thinking and working out, doing some preliminary writing on my next book, and trying to take the speed of life down a gear or two. Vacation for me is being in the same place for an extended period. And getting to talk with Gilder in the evenings about our books is such a treat. He is one of the finest philosophical/sociological/economic/technological minds in the world (in my opinion), and having him to talk with in the evening will help me lay the proper intellectual framework for my book, though I have to work on not distracting him too much.

Last night I had dinner arranged here in Rome with my friend Steve Cucchiaro, his daughter (who was celebrating her birthday), and his son. My group was running late, even though our driver from the airport was driving like we were in a Formula One race. That is typical, but it was not long before we realized he was also drunk and half mad, talking and gesturing to himself the entire time. Obviously, we survived. When we got to our hotel, I was busy getting people to get ready ASAP so we would not be too late. I asked the concierge for directions, and he gave them to me but then said, “Signor Mauldin, you cannot wear that to the Imago restaurant. It is a very nice place.” I pointed out that I had not brought a tie, and he offered me one. So I went to the room and called Steve to tell him we would be a little late. He said jackets were required but no ties.

It turned out he had booked one of the finest places in Rome and got the corner window table overlooking the Spanish Steps and St. Peter’s, with a spectacular sunset/nighttime view. Another special night for the memory book.

It is time to hit the send button, as trains will not wait. I will report from Tuscany next week, by which time Worth and I should have China all figured out – not! But we’ll keep after it. Also, I hope to summarize the speech I did in San Diego. Until then have a great week!

Your thinking I need to get to China analyst,
John Mauldin, 


Get our "Beginner's Guide to Trading Options"....Just Click Here!


Tuesday, February 18, 2014

The Energy Sectors You Should Invest in This Year

Top energy analyst Marin Katusa, frequently featured in the financial media such as Forbes, Business News, Financial Sense News Hour, and the Al Korelin Show, says two undervalued energy sectors will provide windfalls for smart investors this year.

The bullish side: The report details the most bullish energy sectors for 2014 and beyond.

In one of those bullish sectors, there is a country that boasts one of the lowest taxation rates for oil and gas plus has the benefit of a $12.00 per barrel difference in price.

The second one is an energy sector that is extremely undervalued right now, but is slated for major growth this year.

Another is poised to make big gains from the Putinization of Europe—and the resulting push for European countries to produce their own oil and gas.

See which companies are ready to make the biggest gains in the oil and gas industry this year (and it’s not the actual oil and gas producers).

The right time to get into these sectors is now, before the big gains are being made. Investors who get positioned early on can reap big rewards.

The bearish side: There are also three other energy investments that Marin recommends not to touch this year—not because these energy resources don’t have merit (Casey subscribers have invested in them before), but because the risk of losing your money is just too great right now.

Read his assessment, including which energy investments you should be bullish on for 2014 and which you’d only lose money on.

Click here for Marin’s free report, The 2014 Energy Forecast.


Don't miss this weeks free webinar "How to Architect the Trade"


Wednesday, January 29, 2014

Gold and Silver Ready To Rumble Higher?

Let's check in with our trading partner David A Banister, does he think gold and silver is ready to rumble higher?

We have been writing about the bottoming process of the Gold Bear Cycle (Elliott Wave Theory) since December 4th 2013, and our most recent article on December 26th reiterated that the best time to accumulate the Gold/Silver stocks was in the December and January window. Specifically this is what we wrote:

“These types of indicators are coming to a pivot point where Gold is testing the summer 1181 lows…at the same time, we see bottoming 5th wave patterns combining with public sentiment, bullish percent indexes, and 5 year lows in Gold stocks. This is how bottom in Bear cycles form and you are witnessing the makings of a huge bottom between now and early February 2014 if we are right.

The time to buy Gold and Gold stocks is now during the next 4-5 weeks just as we were recommending stocks in late February 2009 with public articles that nobody paid attention to. This is the time to start accumulating quality gold miner and also the precious metals themselves as the bear cycle winds down and the spring comes back to Gold and Silver in 2014.”

Since that article a few of our favorite stocks rallied 40-50% in just 3 weeks or so from the December timeframe of our article. A recent pullback is pretty normal as we set up for Gold to take out the 1271 spot pricing area and run to the mid 1300’s over the next several weeks. By that time, you will be kicking yourself for not being long either the metals themselves or the higher beta stock plays.

A few suggestions that we have already written about we will reiterate here again. Aggressive investors can look at UGLD ETF, which is a 3x long Gold product that will give you upside leverage as Gold moves into elliott wave 3 up. Other more aggressive plays we already recommend a lot lower include GLDX, JNUG, NUGT and others. Picking individual stocks can be even better and we have recommended a few to our subscribers that are already doing very well.

What will trigger this next rally up is sentiment shifts to favor Gold and Silver over currency alternatives. The precious metals move on sentiment, much more so than interest rates or GDP reports or anything else in our opinion. Sentiment remains neutral to bearish as evidenced by the larger brokerage houses running around in January telling everyone to sell Gold, so we see that as a buy signal on top of our other indicators.


We expect the mid 1500’s by sometime this summer, but by then your opportunity will be long in the rear view mirror. Just click here to join us for frequent updates at from David Banister.


Tuesday, January 21, 2014

A Glimpse into the Coming Collapse

By Jeff Thomas, International Man

Beginning in 1999, we predicted a systemic economic collapse that would take place in the First World and would impact all other economies. We began to list some of the "dominoes" that would fall as the collapse evolved and described that the "Great Unravelling," as we termed it, would take roughly ten years. At that time, we guesstimated that the first two of the dominoes, a real estate crash and subsequent stock market crash in the US, would begin in about 2005.


We were premature in this prediction, as the first of the crashes did not occur until 2007. And, truth be told, we have frequently been incorrect in the timing of the other dominoes. Whilst the actual events have been predicted correctly, our timing has often been incorrect. In every such case, the prediction has been premature.

Sadly, however, the prediction of the events of the collapse have been almost entirely correct.

We also predicted that, just as a ball of string speeds up its rotation as it rolls along unravelling, so, too, the events of the Great Unravelling would occur more quickly as the situation worsened. Additionally, the severity of the events would increase concurrently with the increase in velocity.

However, none of the above was the result of gypsy fortune telling, nor did it require the brightest of minds to work out. It is mostly based on the simple assumption that history repeats itself—that the world's leaders make the same mistakes in every era, because human nature never changes. Anyone who is willing to expend the effort to study history diligently and to be prepared to think in contrarian terms, may develop a meaningful insight into the events of the future.

Back in 1999, of course, the very idea that the world was headed for serious economic calamity was considered ridiculous by most. The unfortunate fact is, most people do truly deal in the present, rarely questioning the future beyond what they consider to be the very next event. The truth of this statement is borne out by the fact that the great majority of people, who have already seen the first half of the Great Unravelling come to pass, still somehow cannot imagine the second half—the more disastrous half—as being in any way possible. Surely, somehow, the governments of the world will fix things.

However, the number of people whose eyes have been opened seems to be growing, and many of them are asking what the collapse will look like as it unfolds. What will the symptoms be?

Well, the primary events are fairly predictable: they would include major collapses in the bond and stock markets and possible sudden deflation (primarily of assets), followed by dramatic inflation, if not hyperinflation (primarily of commodities), followed by a crash of several major currencies, particularly the euro and the US dollar.

The secondary events will be less certain, but likely: increased unemployment, currency controls, protective tariffs, severe depression, etc.

But, along the way, there will be numerous surprises—actions taken by governments that may be as unprecedented as they would be unlawful. Why? Because, again, such actions are the norm when a government finds itself losing its grip over the people it perceives as its minions. Here are a few:
  • Travel Restrictions. This will begin with restrictions on foreign travel, including suspension/removal of passports. (This has begun in a small way in both the EU and US.) Later, travel restrictions will be extended within the boundaries of countries (highway checkpoints, etc.)
  • Confiscation of wealth. The EU has instituted the confiscation of bank accounts, which can be expected to become an international form of governmental theft. This does not automatically mean that other assets, such as precious metals and real estate will also be confiscated, but it does mean that the barrier for confiscation has been eliminated. There is therefore no reason to assume that any asset is safe from any government that approves theft through bail-ins.
  • Food Shortages. The food industry operates on very small profit margins and survives only as a result of quick payment of invoices. With dramatic inflation, marginal businesses (suppliers, wholesalers, and retailers) will fall by the wayside. The percentage of failing businesses will be dependent upon the duration and severity of the inflationary trend.
  • Squatters Rebellions. A dramatic increase in the number of home and business foreclosures will result in homelessness for anyone whose debt exceeds his ability to pay—even those who presently appear to be well-off. As numbers rise significantly, a new homeless class will be created amongst the former middle class. As they become more numerous, large scale ownership of property may give way to large scale "possession" of property.
  • Riots. These will likely happen spontaneously due to the above conditions, but if not, governments will create them to justify their desire for greater control of the masses.
  • Martial Law. The US has already prepared for this, with the passing of the 2012 National Defense Authorization Act (NDAA), which many interpret as declaring the US to be a "battlefield." The NDAA allows the suspension of habeas corpus, indefinite detention, and the assumption that any resident may be considered an enemy combatant. Similar legislation may be expected in other countries that perceive martial law as a solution to civil unrest.
The above list is purposely brief—a sampling of eventualities that, should they occur, will almost definitely come unannounced. As the decline unfolds, they will surely happen with greater frequency.

But the value in projecting what the collapsing governments may do to their citizens is not merely an exercise in speculation. By anticipating the likelihood of any of the above, the individual may find that it would be prudent to turn off the game on television tonight and spend his time musing on the possibility of what he would do if any of the above events were to take place. (And, again, these projections are not mere fancy; they are actions typically taken by governments as their declines play out.)

Most importantly, if the reader concludes that there is a significant percentage of likelihood that any of the above are coming his way, he would be well-advised to assess whether they are developments that he feels he could live with. If not, he might wish to assess how much time he has before these events become a reality and what he may do to sidestep their impact on him.

Whilst, throughout the First World, the comment, "The whole world is going to Hell," is becoming common, in fact, this is not the case. Although some countries are in decline, others are on the rise. It is left to the reader to decide whether he will fall victim to coming events, or will use them as an opportunity to internationalise himself.

Editor’s Note: You can find Casey Research’s A-Z guide on internationalization here.


Still a few seats left for next weeks Free Trading webinar. Sign up here and now!


Monday, January 13, 2014

Don't Let Scalping Scare You....Use our Free Trading System Download

For many of our readers at The Hedge Fund University active trading is terrifying. The crazy spreads and crushing risk while you're "super glued" to your chair is not a very appealing way to spend your trading day. But done right, it can be insanely lucrative.

A couple of times a year our friends and trading partners at The Premier Trader University bring us [and our readers] a free download of their popular "Trend Jumper Trading Program".

Check out this FREE System Now

This high frequency system is a "genetically modified" active trading method that cuts your risk while boosting your results. Believe it or not, it's a jaw dropping, easy to learn strategy that's actually fun to trade.

This system regularly sells for $997.00 to the public. In the last release in April, literally hundreds of traders ran to pay full retail price for this system. Price to our readers today? ZERO. That's right, FREE!

But we have managed to convince the developers to let our readers have their best, most lucrative indicators without the triple digit price tag. Right now, you're going to get the two most profitable Trend Jumper trade plans free for life.

Click here to get your FREE Trend Jumper Indicators

Seriously, these two indicators are all you need. No need to upgrade, no need to spend a nickel. Folks are paying hundreds of dollars for the full version. But you'll get the best indicators and they can be used for trading stocks, commodities, Forex, futures and more....all for free.

We'll see you next in the markets. And we'll be using Trend Jumper, will you?

The Hedge Fund University


Get this Free Scalping System Now