Showing posts with label Trend. Show all posts

Friday, April 18, 2014

Doug Casey’s Coming Super Bubble

By Louis James, Chief Metals & Mining Investment Strategist

In many of my conversations with legendary speculator Doug Casey since the crash of 2008, Doug has talked about a coming super bubble.

Everything Doug has studied about human nature, history, and economics—from Roman times right up to the present—has him absolutely convinced that the global economy is headed for high inflation, with a very real potential for hyperinflation in the US.

Ben Bernanke's panicked deployment of squadrons of cash-laden choppers has been emulated around the world. The Bank of International Settlements estimates that global debt markets now exceed $100 trillion.
The laws of economics—maybe even physics—say that this inflation, whenever it arrives, must have consequences… and that those consequences cannot be avoided forever.

The easiest consequence to predict, and the one we're betting heavily on, is that the price of gold will move higher. Much higher. That move will in turn ignite a bubble in gold stocks and, as Doug likes to say, a super-bubble in junior gold stocks.

Jeff Clark, editor of our BIG GOLD newsletter, recently illustrated what such a super-bubble can look like, citing figures from several historic bull markets. I hesitate to repeat any of his figures because the right junior stocks' gains when the market goes bubbly are, frankly, hard to believe. However, it is a fact that quite a few junior stocks achieved the much vaunted 10 bagger status (1,000% gains) in previous bubbles, and some even returned 100 fold.

Here’s the essential reason why junior mining stocks are Doug's favorite speculations.

Let's start at the beginning: Doug's mantra is that one should buy gold for prudence and gold stocks for profit. These are very different kinds of asset deployment.

It's particularly important not to think of gold as an investment, but as wealth protection. It's the only highly liquid financial asset that is not simultaneously someone else's liability. Every ounce of gold you physically possess is value in solid form—there is no short to your long. Come hell or high water, it is value you can liquidate and use to secure your needs. That's why gold is for prudence.

Gold stocks are for speculation because they offer leverage to gold. This is actually true of all mining stocks and, more broadly, of stocks in commodity-related companies; they all tend to magnify the price movements in the underlying commodity. But the phenomenon is especially strong in the highly volatile precious metals.

Allow me to illustrate—and in an effort to avoid seeming overly promotional, I'll show how gold stocks' leverage works on the downside as well as the upside. Bad news first: here's a chart showing how gold retreated during October and November of 2008, the worst two months of that year's crash for mining stocks. Also shown are an index of gold juniors and our own portfolio performance. This was, of course, a terrific time to buy, resulting in spectacular gains over the next two years.


Now the good news: here's a chart showing the performance of the same three things in January and February of this year, which saw a major rally in the gold sector.


Here's one more, with a particularly telling point to make. This is the stock price of ATAC Resources (ATC.V) over the same time period as the chart above. The point I want to draw your attention to is that the company had no major news during the time period shown. It's a Yukon gold play, buried deep under the famous snows of the Great White North, so there's no exploration under way, and there won't be until the snow melts weeks or months from now.


This third chart shows in one simple yet powerful way exactly why Doug loves buying these stocks when they're on sale and selling them when they go into bubble mode. ATAC essentially did nothing and still shot up over an order of magnitude more than gold. Note that while this third chart looks like the second, the scales are quite different. (ATAC, by the way, is part of my special report, 10 Bagger List for 2014, that details nine companies I believe could show 1,000% or more returns this year. Note that the report was written before the big move upward you see in the chart above.)

It's worth emphasizing that ATAC's performance this year is just on a rebound from recent lows—imagine what a stock like this could do when Doug's super-bubble for gold stocks arrives.

But what if it doesn't? Or worse—what if we already missed it?

I remember a conversation with Doug back in 2011, when gold rose to within reach of $2,000 per ounce. Many mainstream analysts said gold was in a bubble. I told Doug I couldn't understand why anyone would listen to analysts who've called the gold trend wrong every year since the current bull cycle started. I remember Doug chuckling and saying: "Just wait and see—this is barely an overture."

I am certain Doug is right. That's not because he's the guru, nor because I'm a nutty gold bug, but because no government in history has ever multiplied its currency base without sparking serious and often fatal inflation. That's a fact, not an opinion, backed by enough data to make me extremely confident in predicting what lies ahead for the US dollar, even if I can't say exactly when we'll reach the tipping point.

Since that 2011 interim peak, as we all know painfully well, gold has backed off on par with the correction in the middle of the great 1970s gold bull market. But economic realities require that the market turn around and head for his long predicted super bubble in junior mining stocks before too long. That makes the correction the last, best time to build a substantial position in the stocks best positioned to profit from the coming bubble.

And now Doug is saying that he believes the upturn is at hand. He expects a steadily rising market for a year or two, perhaps more, but not many more, culminating in a market mania for the record books.

Our market does appear to have bottomed. It may take a while to go into its mania phase, but it's already heating up. No one is going to want to be short when this train leaves the station—and the conductor has blown the whistle.

To find out what you could be missing if you don’t invest in junior mining stocks right now, watch Casey Research’s recent video event, Upturn Millionaires—How to Play the Turning Tides in the Precious Metals Market. With resource and investment experts Doug Casey, Frank Giustra, Rick Rule, Porter Stansberry, Ross Beaty, John Mauldin, Marin Katusa, and myself. Watch it here for free, or click here to find out more about my 10 Bagger List for 2014.

The article Doug Casey’s Coming Super Bubble was originally published at Casey Research


Sign up for one of our Free Trading Webinars....Just Click Here!


Wednesday, April 2, 2014

SP500 ETF Trading Strategies & Plan of Attack for This Week

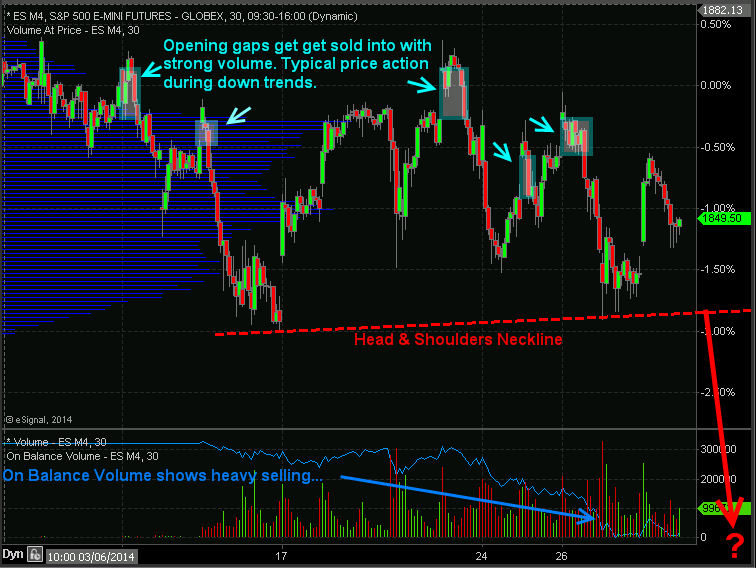
Index ETF Trading Strategies: Stocks have kick started this week with a 0.85% pop in price but the big question is if the market can hold up. Last week stocks repeatedly gap higher and sold off with strong volume telling us that institutions are slowing phasing out of stocks (distribution selling) unloading shares into strength and passing them onto the a average investor to be left holding bag.

I want to show you a couple charts which show the price action, volume and money flow of the SP500 so you have a visual of what I am talking about.

30 Minute Intraday SP500 Chart – ETF Trading Strategies

In the chart below you can see the price gaps followed by selling. Why is this important? It is important because during a down trend the market makers and big money plays who have the money and tools to manipulate the markets will allow the market drift higher or they will run price up in overnight or premarket trading when volume is light. Once the 9:30am ET opening bell rings volume and liquidity spike which allows the big money player to sell remaining long positions and or add to short positions they have.

If you look at the blue on balance volume line at the bottom of the chart you can clearly see that more contracts are being sold than bought which is typically an early warning sign that the market is about to fall farther.

ETF Trading Strategies
 

Automated Trading System – 30 Minute ES Futures Chart


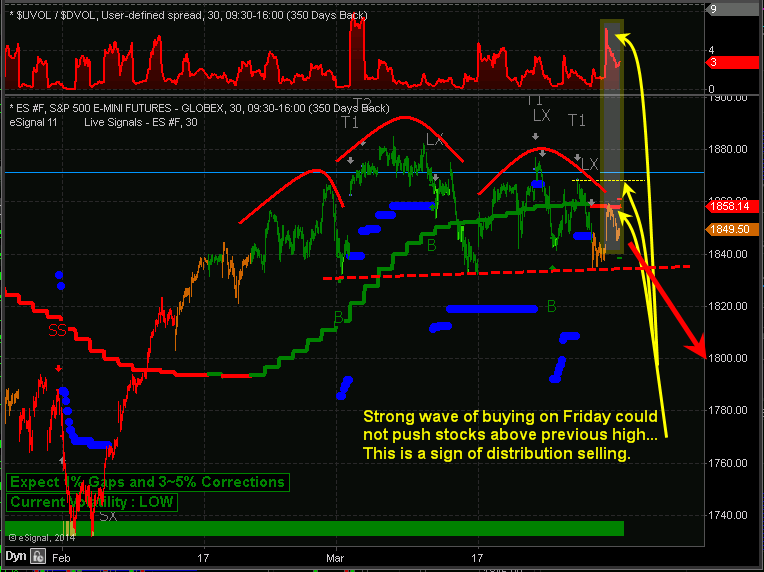
Below is a marked up screen shot of my automated trading system which I use for timing both futures and ETF trading strategies. The color coded bars tell you the market trend along with the strength of buyers and sellers.

When you couple market cycles, trends, volume/money flow, along with chart patterns we can forecast and trade markets with a high degree of accuracy in terms of market direction and timing.

Automated Trading Systems
 
My Index ETF Trading Strategies Conclusion:
 
Just to be clear on the current market trend and my overall outlook let me explain a little more. Overall, the broad stock market remains in an uptrend. Thursday and Friday of last week we started getting orange bars on the chart telling us that cycles, volume, and momentum are now neutral. It’s 50/50 on which way the market will go from here, so until the market internals (cycles, volume, breadth) push the odds in our favor enough for a short sell trade or a new long entry we will not add new positions to our portfolio.

It is important to understand that nearly 75% of stocks/investments move with the broad market. So we don’t want to add more long positions when the odds are not in favor of higher prices. Trading in general is not hard to do, but creating, following, executing properly money and position management is. If you have trouble with following or creating an ETF trading strategy you can have my ETF trading system for rising, falling and sideways markets traded automatically in your trading account.

Learn more here about my Automated Trading Systems

See you in the market! 
Chris Vermeulen


Sign up for one of our Free Trading Webinars....Just Click Here!


Saturday, December 28, 2013

Are the Coffee Bulls Getting the Green Light? JO JVA

Today we are going to take a look at the technical picture for the March Coffee contract NYBOT:KC.H14.E

We'll be analyzing the current coffee chart using the MarketClub Trade Triangle technology. Full disclosure, we are long coffee using the ETF JO.

With futures we use the weekly MarketClub Trade Triangles to tell us the trend and the daily MarketClub Trade Triangles for timing the entry and exits to the trade.

Coffee made a base, has made a breakout of the base to the upside and a test of the base, which means a bottom is probably in for Coffee.

When ever the weekly MarketClub Trade Triangle is green, then you can use daily green Trade Triangles as entry signals to go long in the market.


Get a FREE Trial of the MarketClub Trade Triangle Technology


Monday, December 9, 2013

Christmas Rally Starts Monday....My ETF Trading Strategies

Our trading partner Chris Vermeulan says "Tis the Season for the most powerful seasonality trade of the year". Do you agree?


Seasonal ETF Trading Strategies With the stock market up big in 2013 and most participants are speculating on a pullback in the next week or two, Chris says he is on the other side of that bet. Being a technical trader he focuses on patterns, statistics and probabilities to power his ETF trading strategies. So with 37 years of stats the seasonality chart of the S&P 500 index paints a clear picture of what is likely to happen in December.

If you do not know how to read a seasonality chart, Chris will explain it as its very simple. Simply put, it shows what the index has done on average through each month over the past 37 years. December typically has the strongest up trend and probability of happening any other time of the year.

The Big Board – NYSE
 
The NYSE also referred to as the Big Board, is an index with the largest brand name companies. Most individuals do not follow this, but to Chris its as close to the holy grail of trading than anything else he uses. he uses many different data points from this index (momentum, order flow, trend) for his ETF trading strategies.

Let's take a look at what Chris says the seasonality chart his telling us as we close our 2013 and move into 2014......Click here to check out "Christmas Rally Starts Monday....My ETF Trading Strategies"


Wednesday, May 1, 2013

Does this concern you? Let's look at the "Macro Trend of the Markets"

Great post from our trading partner Doc Severson this morning.....

The Bureau of Labor Statistics stated 60% more seniors are working today than they were 10 years ago. Isn't that shocking? There are some clear reasons for this.

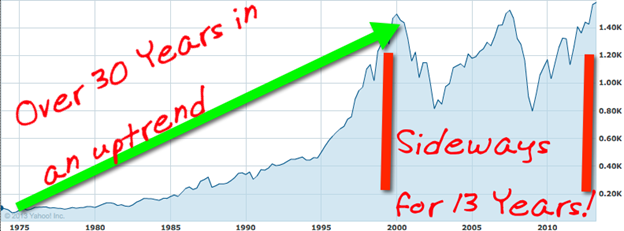
When I was a kid, I was told to "save for retirement" and invest in the stock market. This was good advice when bank interest rates were upwards of 10%, and you could count on the S&P making regular advancements. But over the last 13 years, people are only now starting to see the writing on the wall.

Back in the day, the macro trend of the markets steadily climbed from the mid-70s UNTIL the peak in 2000.

imageForBLS.png


But since the crash in 2000, we've seen nothing but sideways trading for the last 13 years and interest rates at an all time low. During the same time, we also had two major crashes, and well.....who knows what could happen by the end of the year.

So what's next?

I'd rather not pretend to predict the market. Instead, I'll continue to trade a robust trading plan, proven to generate a consistent monthly income during the same time most people have struggled.

It's a system that's taken me years to develop, and is uniquely designed to use a combination of non-directional strategies, semi directional strategies, and directional strategies. This way your trading results are independent of market direction!

Not only will I teach you how to trade these trading strategies, when you enroll in OptionsMD today, I'll take you by the hand to show you exactly what I plan to trade, how I plan to trade it, and let you see my open trades.

So what do you say?

Bottom line....If you want to learn how to make a consistent monthly income by protecting and growing your wealth Click here to join me inside of OptionsMD today!